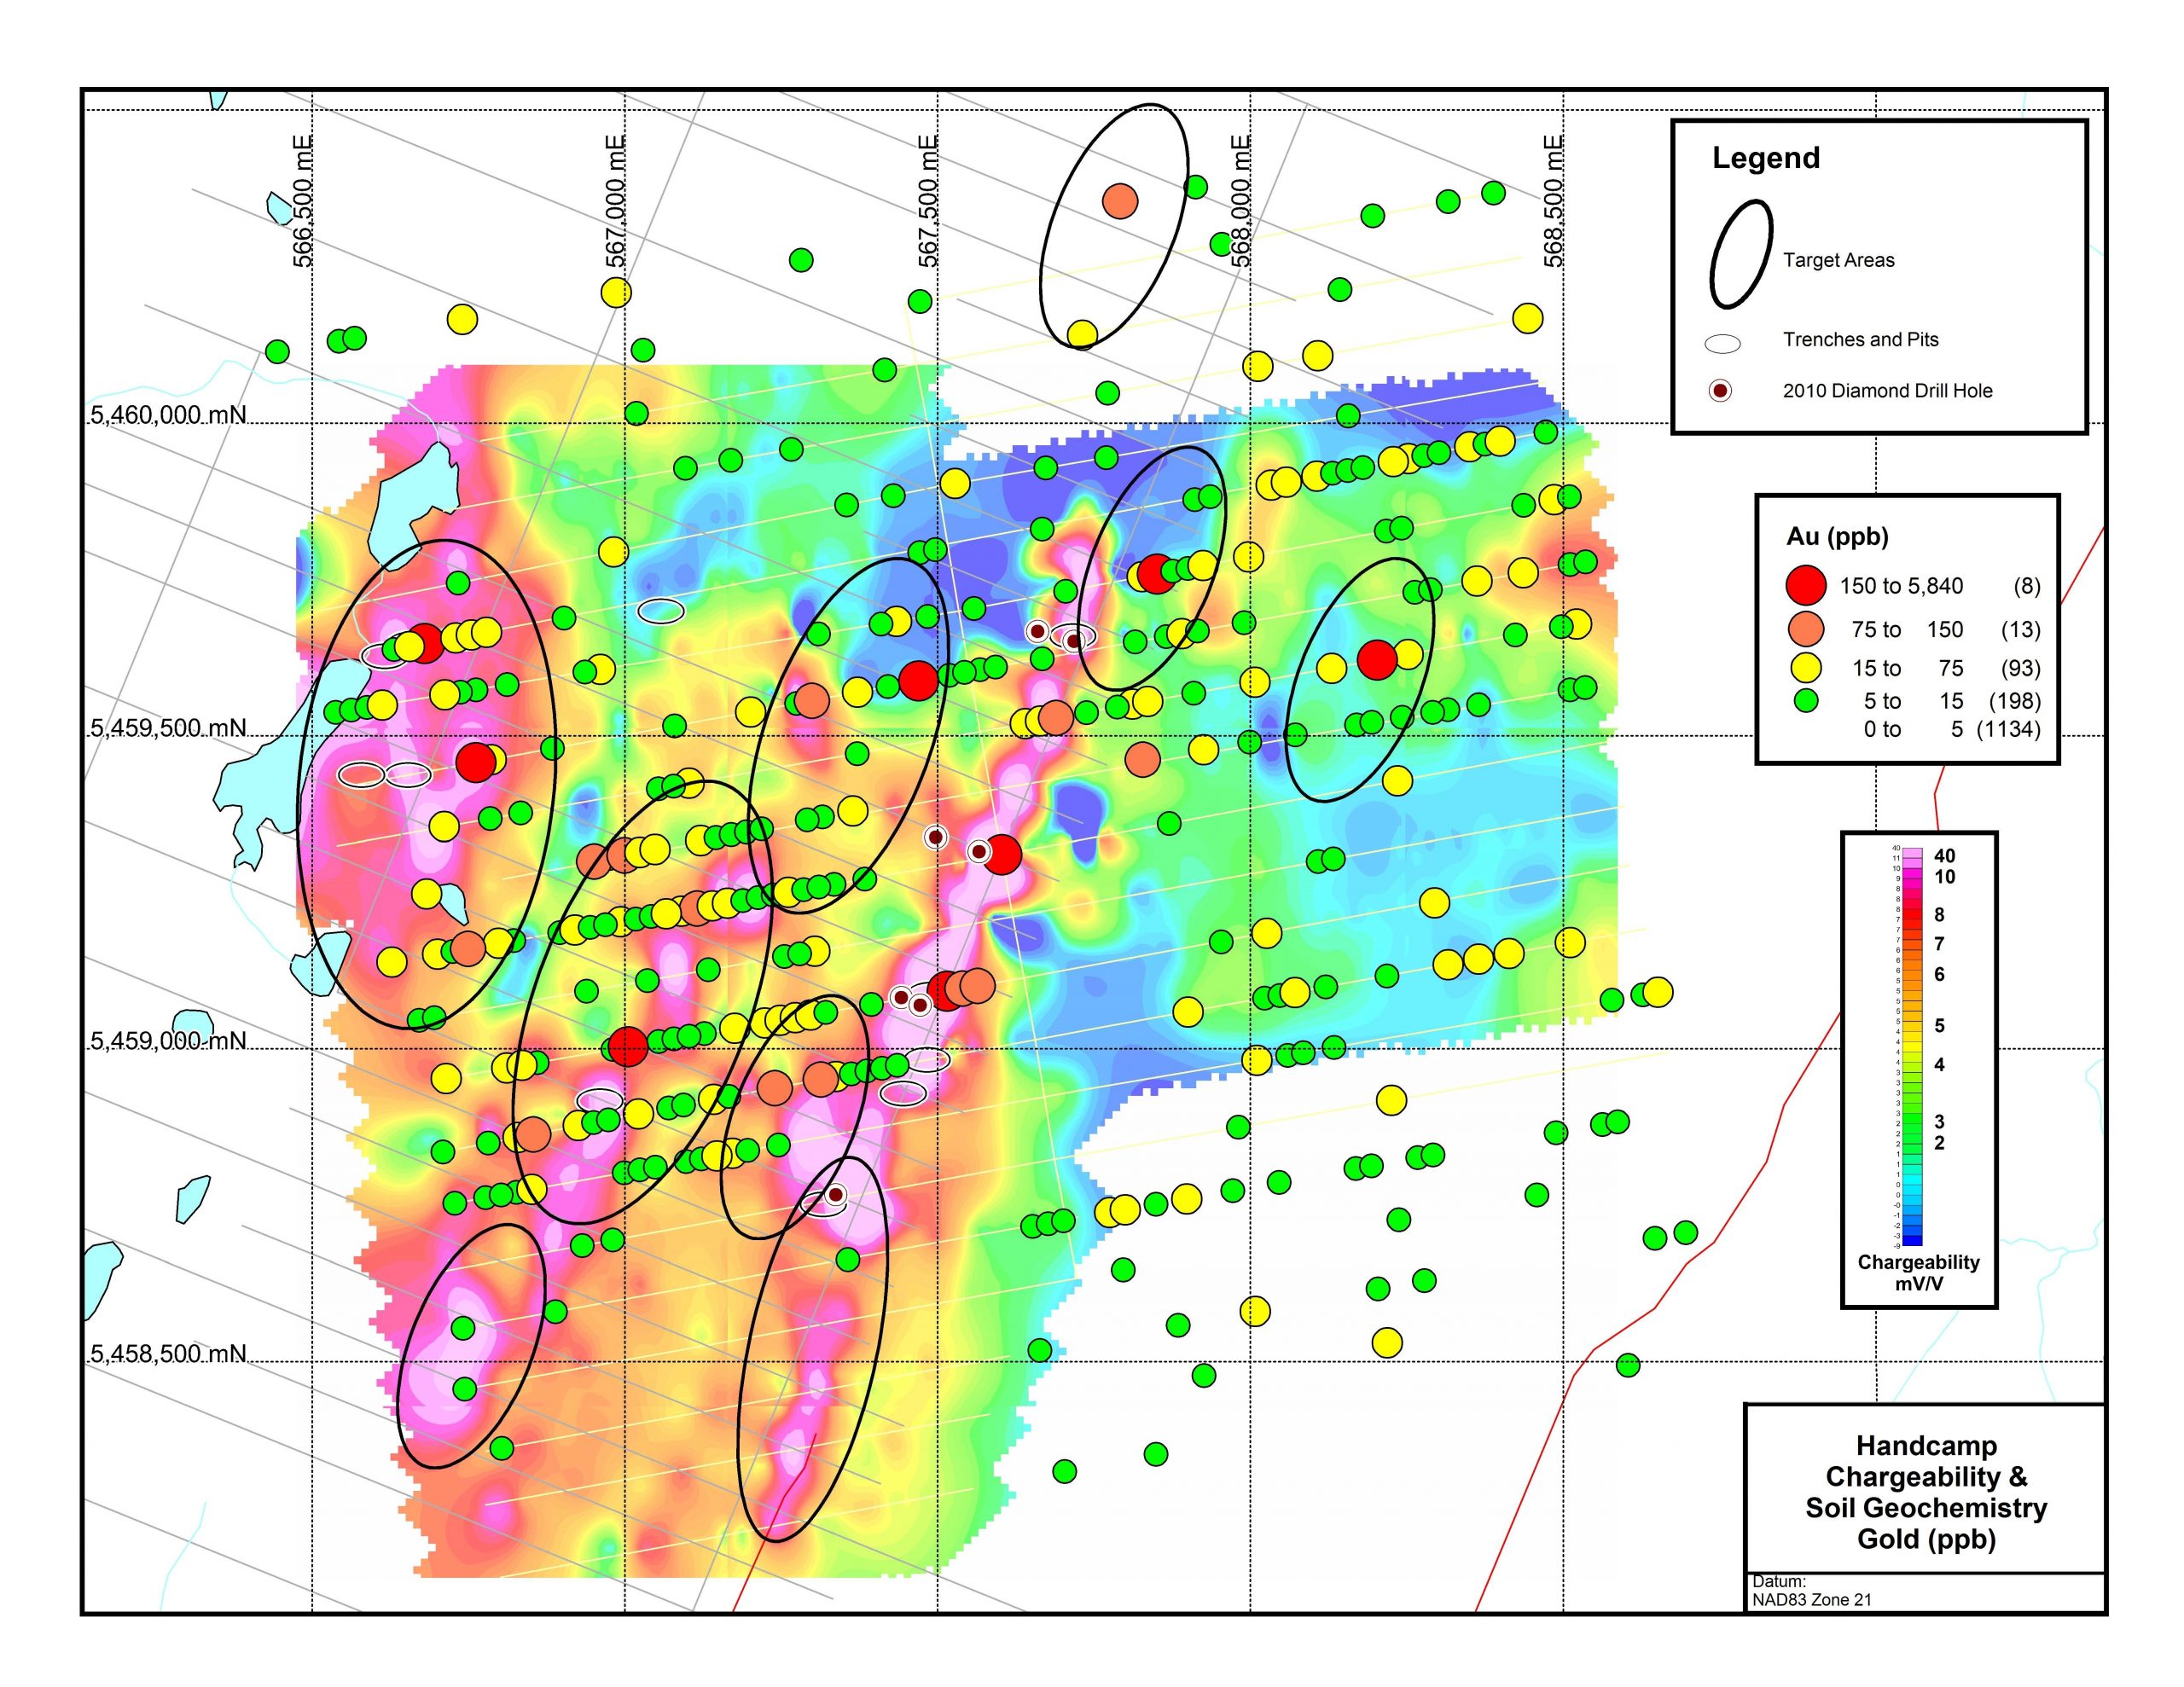
Map showing soil samples containing anomalous gold with target areas outlined in black for samples containing greater than 150 ppb and ranging up to 5840 ppb (5.84 g/t). Note the strong correlation between areas of anomalous gold in soils and IP high chargeability zones outlined in pink with red boundaries (Geofile # 012H/08/2157).


